
Consistently outperforming the market is hard, not many funds do it. Among Canadian domiciled funds in the U.S. Equity category, over3-, 5- and 10-year periods 97%, 95% and 96% of funds have underperformed the S&P 500. (SPIVA Report)
Up and down capture ratios, sometimes called up/down market capture ratios or upside/downside capture ratios, measure how well a fund/ETF did versus an index, like the S&P 500, when the index was up or down. If a fund can outperform, either when the market is up or when the market is down, it has a better chance of outperforming overall. If a fund can outperform when the market is up and when the market is down, it will outperform overall.
Up Capture is calculated by taking the returns of the fund when the index is up, divided by the returns of the index when the index is up.Higher up capture is better and if the up capture is greater than 1 that means that the fund has outperformed the index when the index is up. Sometimes you’ll see it expressed in the 100s, so up capture over 100 would signal outperformance when the market was up, but the fundamentals of the calculations are the same. So, if a U.S. equity ETF returned 2.5% in a month, and the S&P 500 returned 2.1%, then the fund has an up capture of 1.19 for that month.
We know outperformance is good and a high up capture is key in reducing the number one risk we face when investing for retirement, longevity risk – the risk that we will outlive our savings. I go through a little bit more about longevity risk in my last article here.
An up capture greater than 1 usually indicates that the fund is taking on some extra risk or extra volatility to achieve returns that are better than the index. This could be achieved by taking on some more volatile asset classes like small cap stocks or adding a little bit of leverage. But it’s ok to take on some extra volatility risk as long as you’re being rewarded with higher returns and reducing longevity risk.
Down Capture is calculated by taking the returns of the fund when the index is down, divided by the returns of the index when the index is down. Lower down capture is better and a down capture less than 1 means that the fund has outperformed the index when the index is down. If a U.S. equity ETF returned -2% in a month and the index return was -2.5%, then the fund had a down capture of 0.8 for that month.
A down capture less than 1 usually means that the fund is taking a conservative approach and is designed such that protecting downside is a higher priority than achieving high returns. This can be achieved by adding some fixed income, gold, or any other asset class that can offset some losses in the equity markets. Keeping down capture under 1 can also reduce longevity risk as long as the upside isn’t being sacrificed too much.
That brings us back to the holy grail of investing, an up capture over 1 and a down capture less than 1. On average over the past 5 years, mutual funds and ETFs in the Canadian Equity category have an up capture of 0.91 and a down capture of 0.89, so funds are generally capturing less upside than the S&P/TSX Composite, but also less downside. In the U.S. Equity category, the average up capture is 0.91, and the average down capture is 1.00. Most funds cannot produce an up capture greater than 1 and a down capture less than 1, and many fund managers are not trying to do that. A lot of active managers are trying to limit downside and wiling to sacrifice upside.
The ForAll Core & More U.S. Equity Index is designed with the intent to have an up capture over 1, by adding moderate leverage of 1.3x on U.S. equities when signals are strong, and a down capture under 1, by shifting away from equities and into gold when signals are weak.
Up/Down Capture vs S&P 500 CAD Hdg
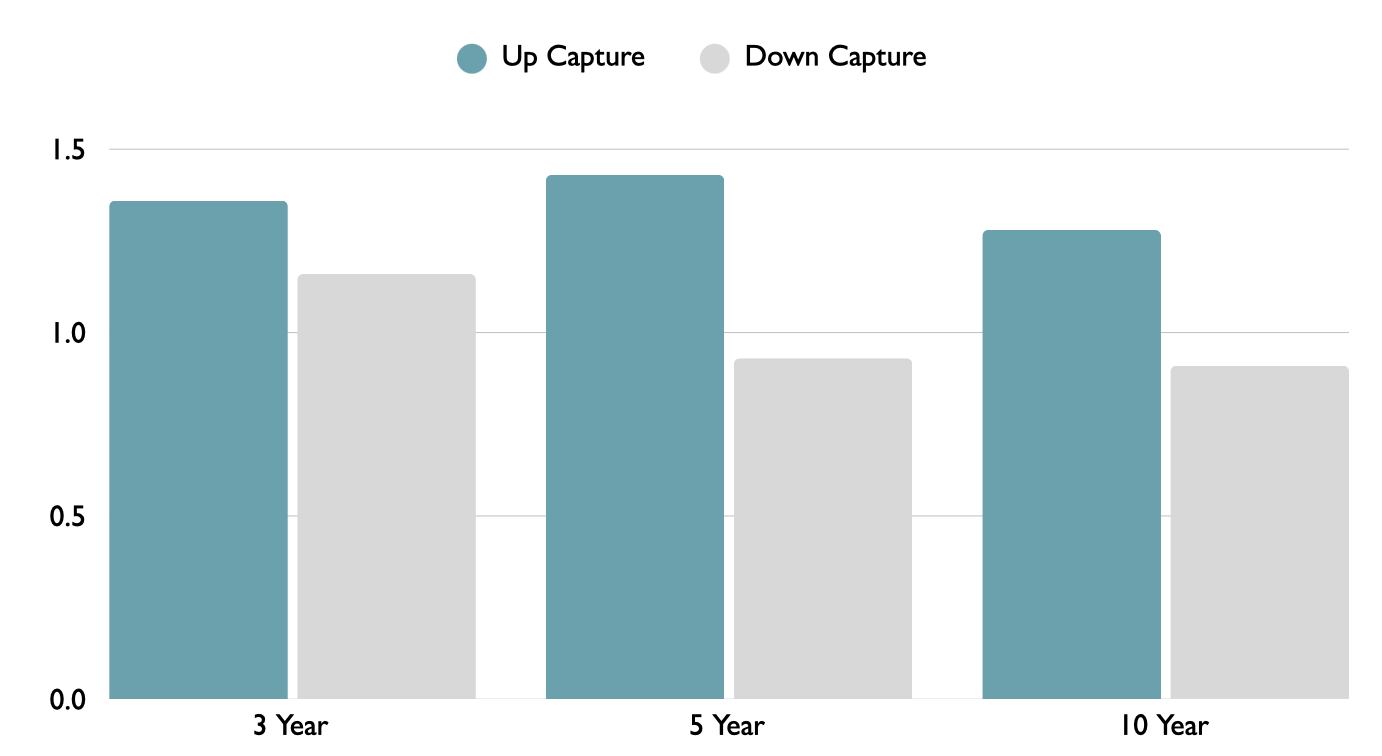
Source: ForAll Investment Research Inc.
Up and Down Capture calculations are based on monthly returns of the ForAll Core & More U.S. Equity Index and the S&P 500 TRCAD Hedged Index. The 3 year numbers are based on the most recent 36 months of data, 5 year numbers on the most recent 60 months, and 10 year numbers on the most recent 120 months of data.
Annualized returns as of May 31, 2026

* Inception 11/11/24.
Commissions, trailing commissions, management fees and expenses all may be associated with investments in ETFs. Please read the prospectus before investing.
The indicated rates of return are the historical annual compounded total returns(or point-to-point total returns, as applicable) including changes in unit value and reinvestment of all distributions, and do not take into account sales, redemption, distribution or optional charges or income taxes payable by any shareholder that would have reduced returns.
Past performance is not indicative of future results.
ETFs are not guaranteed, their values change frequently and past performance may not be repeated. ETFs are bought and sold at market price on an exchange and may trade at a discount or premium to net asset value.
The index referenced herein is calculated by Solactive AG. Any index performance shown is for illustrative purposes only and does not reflect fees, expenses, or transaction costs. Investors cannot invest directly in an index. Performance of the index prior to the live date of November 15,2023 is hypothetical and based on back-tested data using the index methodology. Back-tested results are not actual performance and may not reflect the impact of real market conditions.
A static allocation may not always be sufficient under changing market conditions. The ForAll Core & More U.S. Equity Index is designed to respond to market changes through a disciplined, rules-based approach, seeking to balance participation in market growth with risk management during periods of stress.
For investors looking to complement traditional equity exposure with a more adaptive strategy, FORU offers a systematic framework grounded in data rather than discretion.
Disclaimer
This ETF is an alternative mutual fund, as such, FORU is permitted to invest in asset classes or use investment strategies that are not permitted for other types of mutual funds.
FORU uses leverage which magnifies gains and losses. FORU may obtain leverage by investing more than 10% of its net asset value in other alternative mutual funds that provide leveraged exposure.
Commissions, management fees, and expenses all may be associated with investing in ETFs. Investment objectives, risks, fees, expenses, and other important information are contained in the prospectus; please read it before investing.ETFs are not guaranteed, their values change frequently, and past performance may not be repeated.
This material is for informational purposes only. This material is not intended to be relied upon as research, investment, or tax advice and is not an implied or express recommendation, offer or solicitation to buy or sell any security or to adopt any particular investment or portfolio strategy. Any views and opinions expressed do not take into account the particular investment objectives, needs, restrictions and circumstances of a specific investor and, thus, should not be used as the basis of any specific investment recommendation. Investors should consult a financial and/or tax advisor for financial and/or tax information applicable to their specific situation.
All ETFs, including those that seek to track an index are subject to risk, including the possible loss of principal. Diversification does not ensure a profit or protect against a loss in a declining market. While the LongPointETFs are designed to be as diversified as the original indices they seek to track and may provide greater diversification than an individual investor may achieve independently, any given ETF may not be a diversified investment.
The indicated rates of return are the historical annual compounded total returns including changes in unit value and reinvestment of all distributions and do not take into account sales, redemption, distribution or optional charges or income taxes payable by any security holder that would have reduced returns.
All monetary figures are expressed in Canadian dollars unless otherwise noted.
All data contained herein is provided “as is” and LongPoint makes no representation or warranty of any kind, either express or implied, with respect to such data, the timeliness thereof, the results to be obtained by the use thereof or any other matter. LongPoint expressly disclaims any and all implied warranties, including without limitation, warranties of originality, accuracy, completeness, timeliness, non-infringement, merchantability and fitness for a particular purpose.