
We launched our suite of 2X leveraged Canadian Bank ETFs in October of 2025, providing investors with amplified exposures without having to directly use margin or options. The banks are a key component of the Canadian market and pay consistent dividends potentially making a leveraged total return ETF appealing to investors.
As our SavvyLong Canadian Bank ETFs mark their first anniversary, this milestone provides an opportunity to evaluate ETF and underlying stock performance.
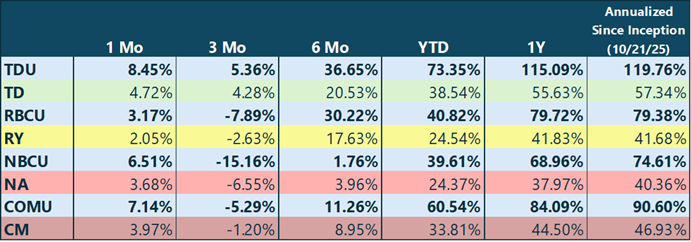
TDU:TSX was the highest performing single bank ETF in Canada on a 1-year basis as of October 30th, 2026.
Source: Bloomberg as at October 30th , 2026.
Commissions, trailing commissions, management fees and expenses all may be associated with investments in ETFs. Please read the prospectus before investing.
The indicated rates of return are the historical annual compounded total returns(or point-to-point total returns, as applicable) including changes in unit value and reinvestment of all distributions, and do not take into account sales, redemption, distribution or optional charges or income taxes payable by any shareholder that would have reduced returns.
Past performance is not indicative of future results.
ETFs are not guaranteed, their values change frequently and past performance may not be repeated. ETFs are bought and sold at market price on an exchange and may trade at a discount or premium to net asset value.
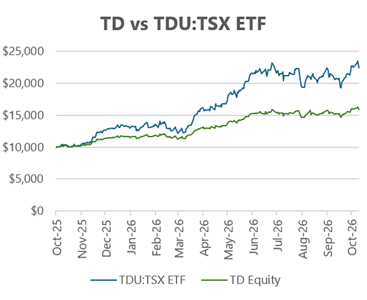
TDU:TSX was the highest performing single bank ETF in Canada on a 1-year basis as of October 30th, 2026, returning 115.09% and outperforming its underlying stock by more than 100%. The ETF’s excess return was 4% more than 2X the return of TD. With extended periods of positive daily returns, the daily reset leverage can compound the ETF’s return beyond the leverage ratio.
TD returned 55.63% since October 31st, 2025, including a 2.48% dividend yield. This performance comes after a deep discounting relative to peers sparked by TD’s ~$3.1B US anti-money-laundering settlement from late 2024. Over 2026, TD consistently beat consensus earnings expectations driven by growth in their wealth, capital markets and insurance revenues. Lower expectations on revenue and EPS and a $2B reduction in expenses supported dividend increases which allowed TD to start a $6-7B buyback program and target a 40-50% dividend payout target over the next 4 years. TD sold $32B USD in assets for a $1.6B USD loss, creating a net income pre-tax benefit of approximately $550M USD in 2026. This move gave them the capacity to grow their US assets by up to $50B USD under the asset cap set in place. Going forward, TD is targeting EPS growth of 7-10% and ROE growth of 16%. After a year of catch up, they continue to look positive going into their 2027 fiscal year.
Source: Bloomberg, October 30th, 2026
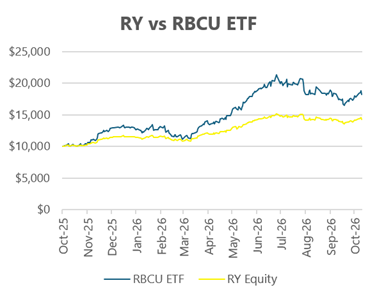
RBCU returned 79.72% and benefitted from RBC having the lowest volatility and the lowest beta of all the Canadian banks. This relative lack of volatility slightly limited their performance but created a smoother ride for leveraged ETF traders.
RBC held up better than the other banks during the tariff fuelled downturn earlier in the year and participated in the same capital markets and wealth upside to a slightly lesser extent in returns. From a financials standpoint, they’re coming off a record year in 2025 becoming the first Canadian bank to report over $20B in net income, and on track to potentially beat that number in 2026 consistently beating EPS and revenue targets. RBC also achieved costs synergies with HSBC Canada of $760M ahead of schedule improving their bottom line for the coming years and potentially starting to realize more income from this new arm of the business. Over the last quarter they bought back $1.6B of stock and paid $2.4B in dividends leaving them with capital north of $7B. They are likely going to use this capital to invest in capital markets expansion through hiring, AI investment and international expansion heading into 2027.
Source: Bloomberg, October 30th, 2026
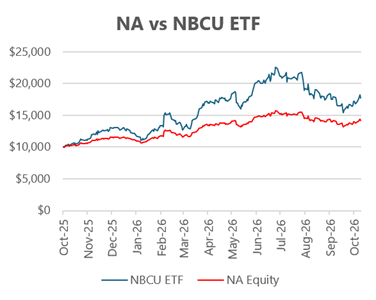
NBCU returned 68.96%, almost double National Bank stock total return.
National Bank had the lowest level of return among the big 6 Canadian Banks, appreciating 37.97% over the past year with the second highest volatility over the same period. National has the lowest correlation with the other Canadian banks. Their acquisition of Canadian Western Bank a couple of years prior delivered cost synergies ahead of schedule which eases integration concerns. This has helped align them with peers on their ROE expectations. They are also set to acquire Laurentian Bank’s retail and SME portfolios as well as their syndicated loans adding $5B of loans and over $8B in deposits. Over the last year they’ve generally moved with their sector outperforming after their earnings announcement following Q1 and again after they were re-rated by analysts later in the year. National achieved a record level of capital markets net income reporting significant year over year growth. This capital markets performance and their wealth revenues have been the primary drivers of positive surprises across EPS and revenue.
Source: Bloomberg, October 30th, 2026
COMU returned 84.09%. CIBC has the lowest dividend payout ratio of any of the big 6 Canadian banks insinuating that they are focussing on investment in the firm and have the most runway for potential dividend growth.
CIBC was the third highest performer over the year but the most volatile. Like their peers they consistently beat EPS and revenue estimates and had re-ratings of future ROE to around 17% expected next year. They were upgraded by Barclays from underweight to overweight among the big 6 Canadian banks early in the year supporting their stock price going into the downturn caused by tariffs. They sold their Caribbean banking arm to Butterfield Bank for approximately $1.6B, retaining 22% ownership. They simultaneously announced a buyback program to repurchase up to 30 million shares (3.3% outstanding) using the proceeds from their Caribbean divestiture. Q3 of 2026 was CIBC’s 12th consecutive quarter with positive operating leverage reporting double digit growth in adjusted EPS and revenue year over year largely driven by growth in capital markets, wealth management and commercial banking. Most revenue and growth targets have been raised going into 2027 which appear necessary to meet or beat to try and bring their relatively high P/E compared to their historical average.
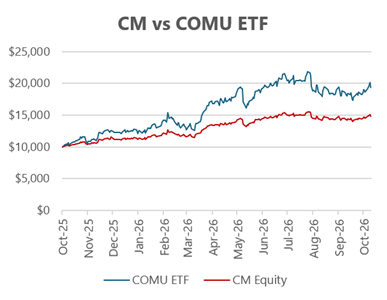
Source: Bloomberg, October 30th, 2026
Daily rebalancing has important implications for the performance of a leveraged ETF for periods longer than a day. For leveraged long ETFs, increases in the benchmark push the daily leveraged ETFs net assets higher, which means an increase in exposure by a multiple of the gain in its net assets. Decreases in the benchmark index led to a decline in net assets, which results in a reduction of exposure in an amount which is a multiple of the decline in the net assets. This means that a daily leveraged long ETF responds to gains by becoming more aggressive and responds to losses by becoming more defensive.
If the benchmark trends upward over several days, the leveraged long ETF’s gains can exceed the cumulative benchmark return multiplied by the ETF's target multiple. If the benchmark trends downward over several days, the leveraged long ETF's loss may be smaller than the cumulative benchmark return multiplied by the ETF's target multiple. In volatile markets with no clear trend, the impact of daily rebalancing can be harmful to the performance of leveraged ETFs over time. A continued pattern of this sort will typically reduce the longer-term returns of the ETF.
As one of Canada’s fastest growing ETF issuers, we are always on the move. Whether we’re launching new Mega or Savvy ETFs or working with asset managers to bring truly unique ETFs to the Canadian space through the LongPoint Partnership Platform, we always have something new to report.
Our weekly newsletter, The Long & Short Point, is a great way to stay up to date. Delivered to your inbox every Monday, Subscribe here.
Or if you prefer to read along on LinkedIn, Subscribe here.
This article is intended for active, high-conviction investors. Always read the full prospectus and disclaimers before investing. Visit www.longpointetfs.com for more information.
LongPoint’s Proprietary ETFs, which include the Mega ETFs, Savvy ETFs and Geared ETFs (the “Proprietary ETFs”), are all alternative mutual funds, and as such, are permitted to invest in asset classes or use investment strategies that are not permitted for other types of mutual funds. The Proprietary ETFs are highly speculative and use a significant amount of leverage which magnifies gains and losses.
The Proprietary ETFs are intended for use in daily or short-term trading strategies by very knowledgeable, sophisticated investors. If you hold a Proprietary ETF for more than one day, your return could vary considerably from that ETF's daily target return. The Proprietary ETFs are not suitable for investors who do not intend to actively monitor and manage their investments.
The Proprietary ETFs, through the use of leverage, may experience amplified losses and should not be expected to deliver their daily return objective over any period of time other than daily. The returns of the Proprietary ETFs over periods longer than one day will likely differ in amount and possibly direction from the performance or inverse performance, as applicable, of their daily target for the same period. This effect is more pronounced for the Proprietary ETFs as the volatility of the daily target and/or the period of time increases. An investor in a Proprietary ETF could lose their entire investment within a single day if the daily target experiences a significant gain or loss, as applicable, that day. This material is for informational purposes only. This material is not intended to be relied upon as research, investment, or tax advice and is not an implied or express recommendation, offer or solicitation to buy or sell any security or to adopt any particular investment or portfolio strategy. Any views and opinions expressed do not take into account the particular investment objectives, needs, restrictions and circumstances of a specific investor and, thus, should not be used as the basis of any specific investment recommendation. Investors should consult a financial and/or tax advisor for financial and/or tax information applicable to their specific situation. All ETFs, including those that seek to track an index are subject to risk, including the possible loss of principal. Diversification does not ensure a profit or protect against a loss in a declining market. While the LongPoint ETFs are designed to be as diversified as the original indices they seek to track and may provide greater diversification than an individual investor may achieve independently, any given ETF may not be a diversified investment. Before investing in shares of the ETFs, investors should consider their ongoing obligations with respect to insider trading, insider reporting, and take-over bids under the Securities Act (Ontario) or other relevant securities legislation (including National Instruments) and as explained in National Policies. Securities regulators may take the view that these provisions extend to the purchase and sale of Shares of the ETFs as they invest in securities of a single issuer, including on a look-through basis.
All data contained herein is provided “as is” and LongPoint makes no representation or warranty of any kind, either express or implied, with respect to such data, the timeliness thereof, the results to be obtained by the use thereof or any other matter. LongPoint expressly disclaims any and all implied warranties, including without limitation, warranties of originality, accuracy, completeness, timeliness, non-infringement, merchantability and fitness for a particular purpose.
LongPoint ETFs · 390 Bay St · Suite 922 · Toronto, ON M5H 2Y2 · Canada